Monthly bulletin, near-daily imagery
USF Optical Oceanography Laboratory
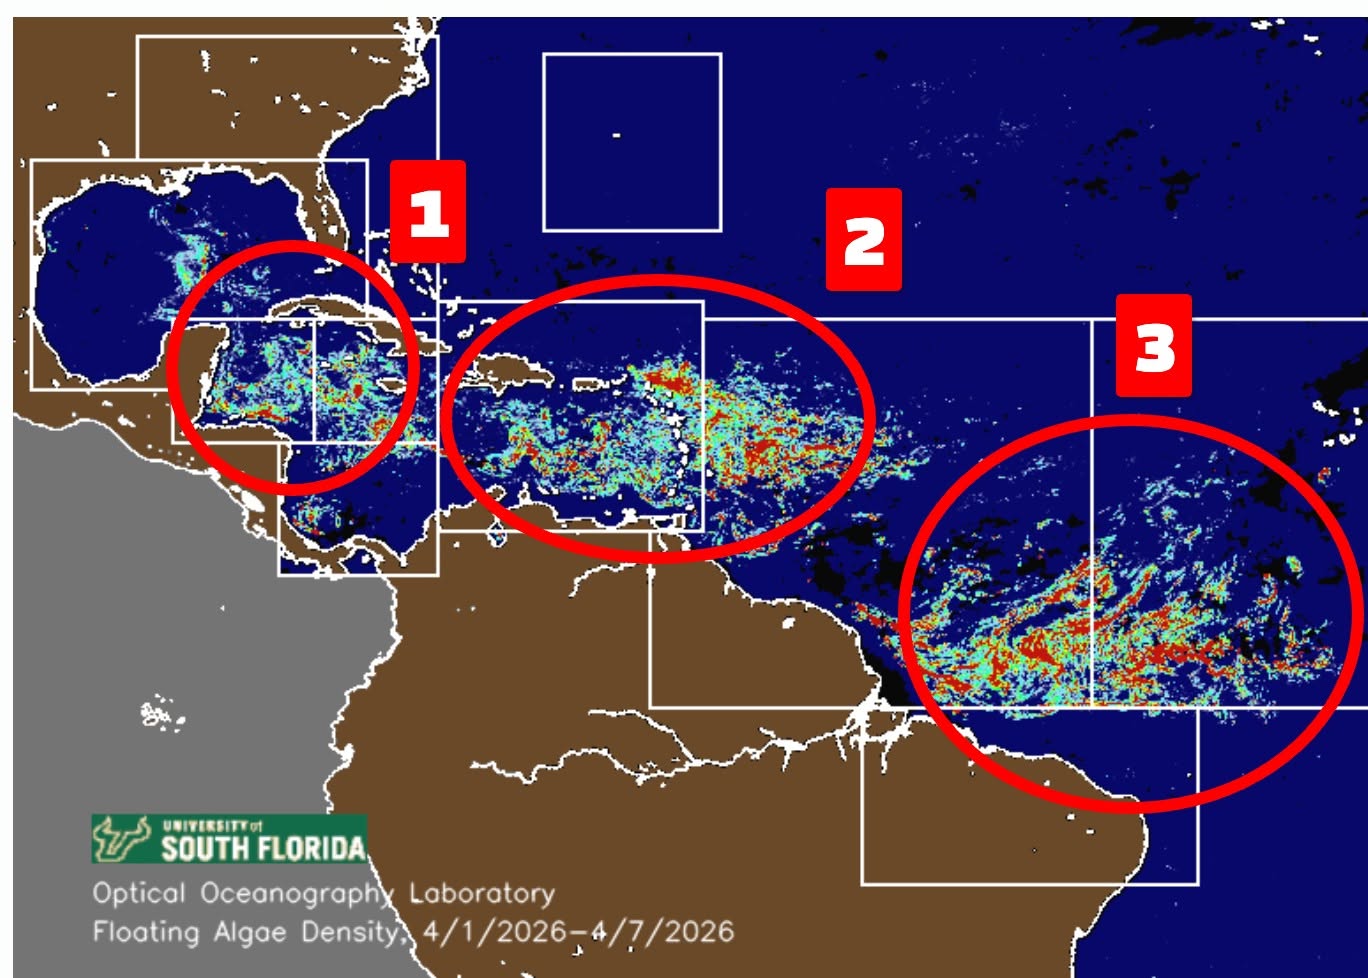
Satellite-derived Floating Algae Density and monthly Sargassum outlook bulletins for the Great Atlantic Sargassum Belt.
Open feed →Live conditions
Interception is only lawful and defensible when detection is real. These are the feeds that establish whether an accumulation is dispersed offshore habitat or a documented shoreward-bound mass.
Live map
Every marker is a documented watch site with its own source. Filter by stage, open a marker for the current read and jump straight to the underlying feed.
Blue-Brown interface
The operating rules the pilot would run on. Distance alone never authorises collection — the corridor opens only when forecast confidence, wildlife clearance, a safe window and a receiving destination all hold at once.
Blue-Brown interface
Zone C is never triggered by distance alone. Move the conditions and watch the operating posture change.
Zone C · Response corridor
Response corridor — permitted low-speed extraction
Forecast + field verification + wildlife clearance + receiving destination.
Stranding probability 70% with 55% mat density.
Wildlife clearance, safe window and receiving destination are all confirmed.
Extraction runs at the velocity differential with observers and stop rules live.
Illustrative decision aid built from the published operating rules. It is not an agency determination and does not authorise any activity.
Stage map
The Great Atlantic Sargassum Belt stretches from West Africa to the Gulf. Every coast inside it is on the same clock.
Ctrl + scroll to zoom
Stage readout
Satellite
Feeds
A scheduled backend job refreshes these feeds and logs each run. Nothing publishes to the site without moderator review.
Monthly bulletin, near-daily imagery
Satellite-derived Floating Algae Density and monthly Sargassum outlook bulletins for the Great Atlantic Sargassum Belt.
Open feed →Continuous
Crowd- and observer-fed official map of arrivals across the Caribbean, Mexico and Atlantic coastlines.
Open feed →Daily
Regional beach-by-beach condition tracking, including a USA view.
Open feed →Daily
Daily 1 km inundation-risk product for Caribbean and Gulf shorelines. The underlying USF AFAI grids (1-day, 3-day, 7-day) are published as an open ERDDAP API, so we query the data directly rather than scraping the viewer.
Open feed →Daily
Ocean color, sea surface temperature and drift products used for shoreward-bound detection.
Open feed →Study releases
Economic impact modeling for Puerto Rico, the U.S. Virgin Islands and coastal Florida.
Open feed →